|
PART I INTRODUCTION I. COUNTRY AND PEOPLE This report is based on the data collected during the last census conducted in 1991. We stress, however, that the 1991 census does not provide a full and accurate picture of population trends as it does not reflect critical changes that occurred after the beginning of the aggression on Croatia in 1991, the occupation of one quarter of its territory, genocide, ethnic cleansing of all the non-Serbian population, Croats as well as members of national minorities such as Hungarians, Slovaks, Czechs, Ruthenians, Ukrainians, Romanies, Germans, Austrians and others. Non-Serbian inhabitants were either killed or forcibly driven out from their centuries-old habitat. Next, there were two waves of refugees arriving to Croatia; one from the Federal Republic of Yugoslavia and the other from Bosnia and Herzegovina. The population structure was further affected by another great wave of refugees streaming into the country after the outbreak of war in Bosnia and Herzegovina. Apart from ethnic Croats, these refugees included many Moslems, Romanies, Rutheniens, Ukrainians and members of other national minorities. After the occupied territories of Croatia had been liberated, a number of Serbs left the country, but the last several years have witnessed their gradual return. The other ongoing process is the return of the displaced population into the formerly occupied territories of Croatia, as well as the return of a certain number of refugees to Bosnia and Herzegovina. The completion of this process, however, requires (re)construction of houses, industrial facilities, infrastructure, schools, cultural and religious institutions, as well as reparation of damages, caused by pillage and destruction during the aggression. It is therefore expected that the next census will offer a more accurate picture of the structure of the population in Croatia.
A. Demographic and ethnic structure of population1. Population by gender and population by rural/urban areas
2. Vital statistics indices According to the 1995 vital statistics indices, the birth rate (number of newborn children per 1000 inhabitants) was 11.2.
3. Population under 15 and over 65 years of age
4. Life expectancy According to the data for the 1988-1990 period, the average life expectancy in the Republic of Croatia was 72 years, or more specifically, 75.87 years for women and 68.25 years for men. 5. Infant mortality rate in 1995
6. Population by gender of the household provider
7. Population by religious identity and gender
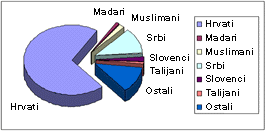
Source: State Bureau of Statistics - the 1991 census 8. Population by ethnic identity and gender
1*Article 170 of the Constitution of the former SFRY and the provisions of the Constitution of the Socialist Republic of Croatia, guaranteed the freedom of expression of nationality, but also allowed citizens to declare Yugoslav nationality. Source: State Bureau of Statistics - the 1991 census 9. Population by mother tongue
Source: State Bureau of Statistics - the 1991 census NOTE: Croatoserbian language was an artificial creation. In spite of strong pressures put on the people to accept it, the majority stated their mother tongue was Croatian. 10. Territorial distribution of national minorities According to the 1991 census, persons belonging to national minorities make up 16.9%, or a little over one-sixth of the total population, while Croats account for four-fifths (78.1%) of the total population. When comparing Croatia to the other 5 former Yugoslav republics, only Slovenia has a more ethnically homogeneous population. The point of difference between the two countries is the greater number of different national minorities in Croatia; there are as many as 16 organized national minorities. A rather more intense mixing of different structures of the population occurred as a result of different movements, primarily due to the advance of Turks across the south-east of Europe, but also due to the movements of population from the Dinaric mountain regions towards the north and north-west of Eastern Europe. In the Austro-Hungarian monarchy, significant new movements of the population took place. For instance, Czechs and Slovaks resettled in Croatia, while Croats moved into traditionally Czech and Slovak lands. The most recent movements occurred in the former Yugoslavia, mostly owing to the better employment opportunities in Croatia and Slovenia. In certain areas of Croatia, especially in parts of Slavonia, there is a multitude of different national minorities. Small settlements of one national minority often exist in the midst of predominantly Croatian or other national minority population. According to the 1991 (the last) census, for instance, in the wider area of Pakrac there is an Italian settlement (totaling 869 inhabitants), which preserved its ethnic and cultural identity in spite of its more than a century-long existence away from either its ethnic homeland, or the more numerous ethnic Italian community, traditionally living in Istria. In certain other areas, neither Croats nor any other single ethnic group constitute the absolute majority of the local population. For instance, Beli Manastir and the area around it, have a total number of 54,000 inhabitants, with a relative majority of 22,740 Croats, followed by 13,851 Serbs and 8,956 Hungarians. Daruvar and its vicinity have a total of 30,000 inhabitants. Again, the relative majority or 10.459 are Croats, 10,074 are Serbs and 5,572 Czechs. In the town and area of Grubisno Polje lives a total of 14,000 people, out of which a relative majority or 6,015 are Croats, 4,540 are Serbs, 1,953 Czechs and 498 Hungarians. According to the 1991 census, the town and area of Vukovar have a total population of 84.000, out of which a relative majority or 36,910 are Croats, 31,445 Serbs, 2,284 Ruthenians, 793 Ukrainians, 1,383 Slovaks and 1,375 Hungarians. Also in the same area, surrounded by mostly Croatian or Serbian populated settlements, there is a Ruthenian and Ukrainian village of Petrovci. It should be emphasized that, alongside with Croats, members of all non-Serbian national minorities were targeted during the aggression on Croatia. 11. Literacy of the population group over the age of 10
B. Socio-economic indicators12. Transformation of economy and privatization Like the economies of the other, formerly "communist block" countries, the Croatian economy began the process of its transformation to a market economy immediately after the introduction of the multiparty parliamentary democracy. One of the key elements of this process was the transformation of the so-called public or social ownership into private ownership. Although the war and the aggression on Croatia had slowed down the implementation of this process, the results achieved up until 1996 did not fall behind the results achieved by other countries in transition. A programme of economic stabilization was implemented simultaneously with the privatization process. As a result of the military aggression, the Croatian economy suffered enormous damages (one third of the industrial and numerous infrastructure facilities were destroyed, tourism revenues dropped sharply, etc.), while at the same time a huge financial burden of care for refugees and displaced persons was imposed on the country (at some moments up to 700.000 refugees and displaced persons). In spite of these facts, the Croatian economy did not suffer a breakdown. Moreover, according to some indicators (inflation rate and foreign exchange reserves, for instance) it ranks among the more successful transitional economies. Below is a summary of basic economic indicators. 13. Gross National Product According to the State Bureau of Statistics, in 1997 the Gross National Product per capita was 26,036 kunas or US $4,225. 14. Foreign debt of the Republic of Croatia (in US $mil, mean rate of NBH - National Bank of Croatia)
Source: National Bank of Croatia 15. Inflation rate The inflation rate calculated at retail prices in 1997 was 3.6%. 16. Unemployment rate In October 1998, the unemployment rate was 18.0%.
C. Female households, migrant workers and refugees17. Households by gender of the main provider
18. Total number of workers by place of employment - migrant workers
19. Refugee population by age and gender groups
| ||||||||||||||||||||||||||||||||||||||||||||||||||||||||||||||||||||||||||||||||||||||||||||||||||||||||||||||||||||||||||||||||||||||||||||||||||||||||||||||||||||||||||||||||||||||||||||||||||||||||||||||||||||||||||||||||||||||||||||||||||||||||||||||||||||||||||||||||||||||||||||||||||||||||||||||||||||||||||||||||||||||||||||||||||||||||||||||||||||||||||||||||||||||||||||||||||||||||||||||||||||||||||||||||||||||||||||||||||